Renewable Energy Project Finance Model Template
- This is a digital download purchase. You will need Microsoft Excel to open and work with this file.
- After purchasing a template with consultation, please proceed to the booking page to schedule your consultation.
Renewable Energy Project Finance Model Template
The Renewable Energy Project Finance model is used to provide a forecast and profitability analysis of a renewable energy project. This provides analysis for Free Cash Flow, IRR, Cash on Cash and Payback on the project level. Included in the template you will find:
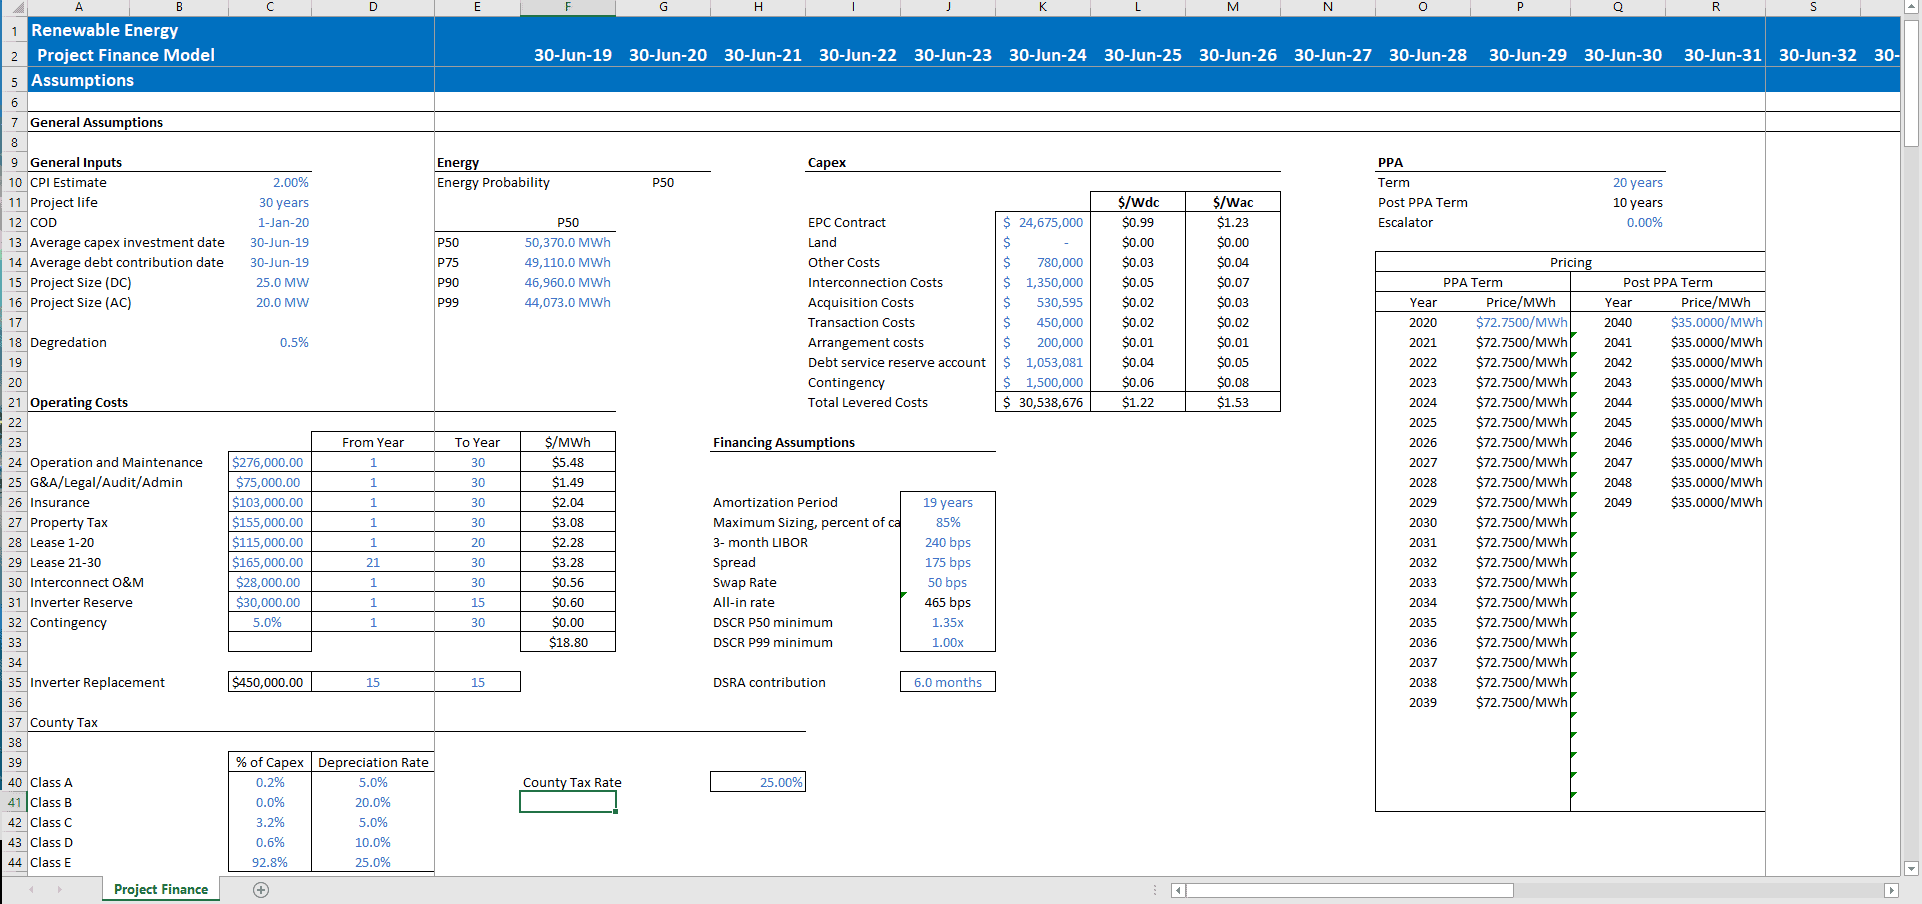
- An Assumptions Section specific to renewable energy such as energy probability, project life, project size and PPA terms
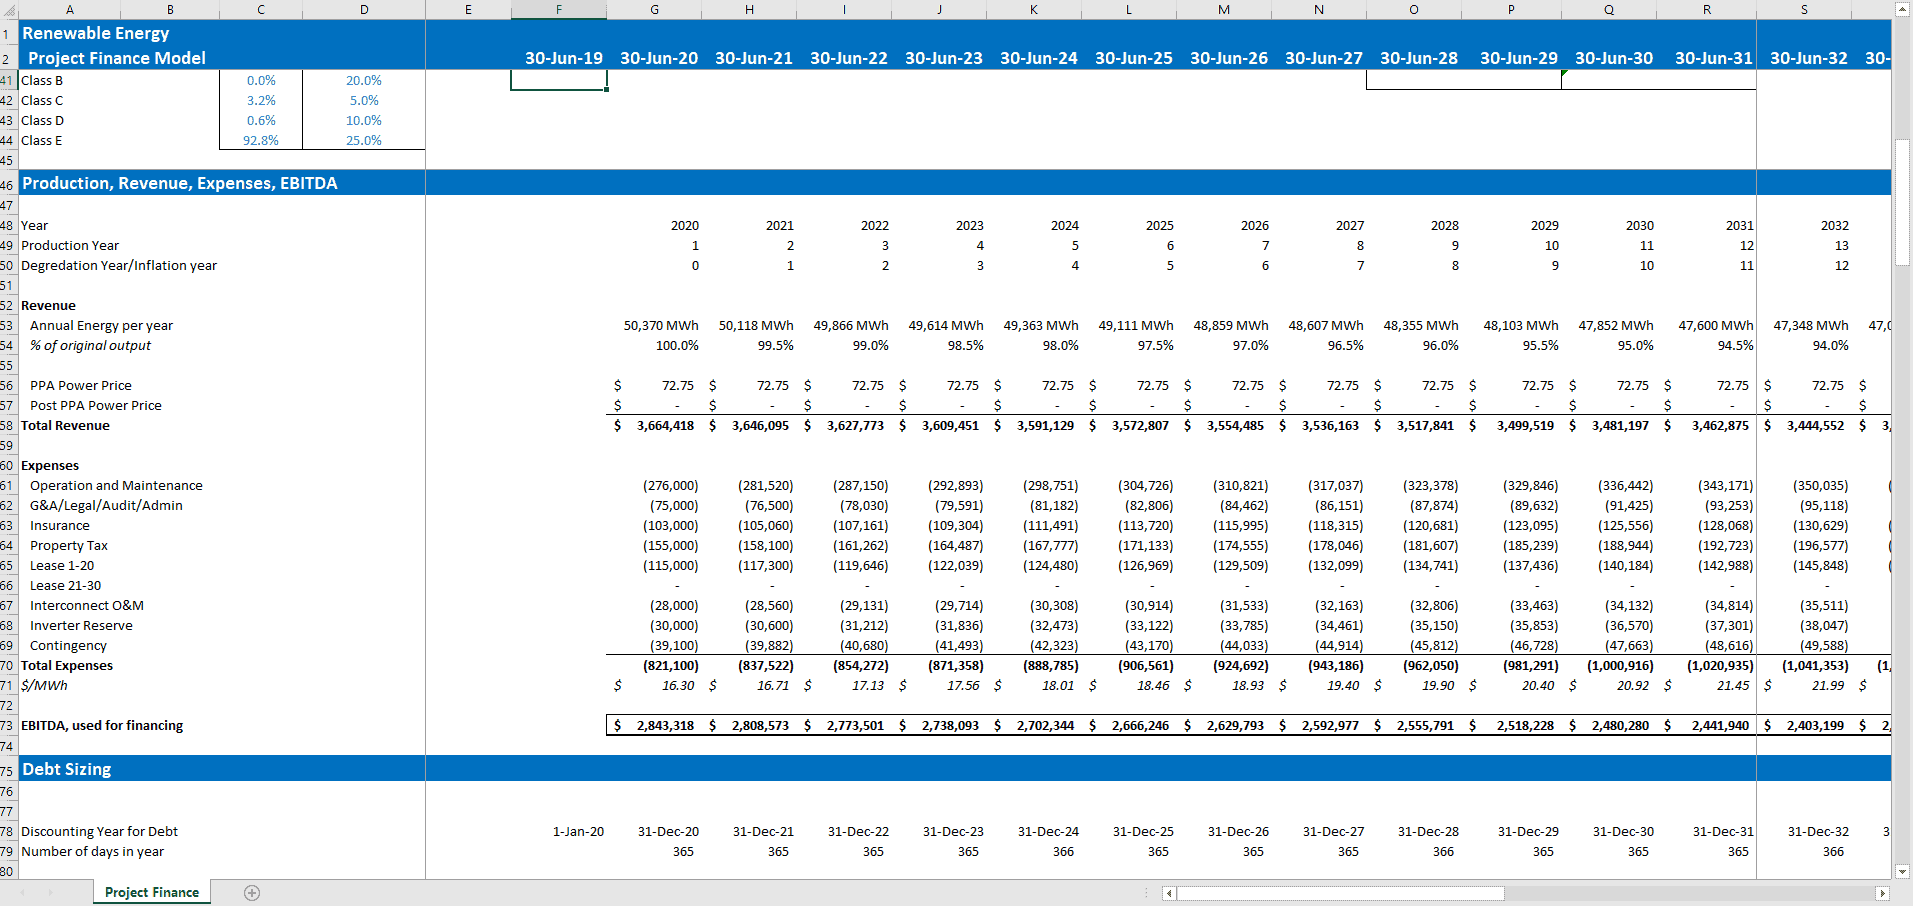
- Production and Financial Section with the Profit & Loss of the renewable energy project
- Debt Sizing Section that breaks down the debt payments and debt service coverage
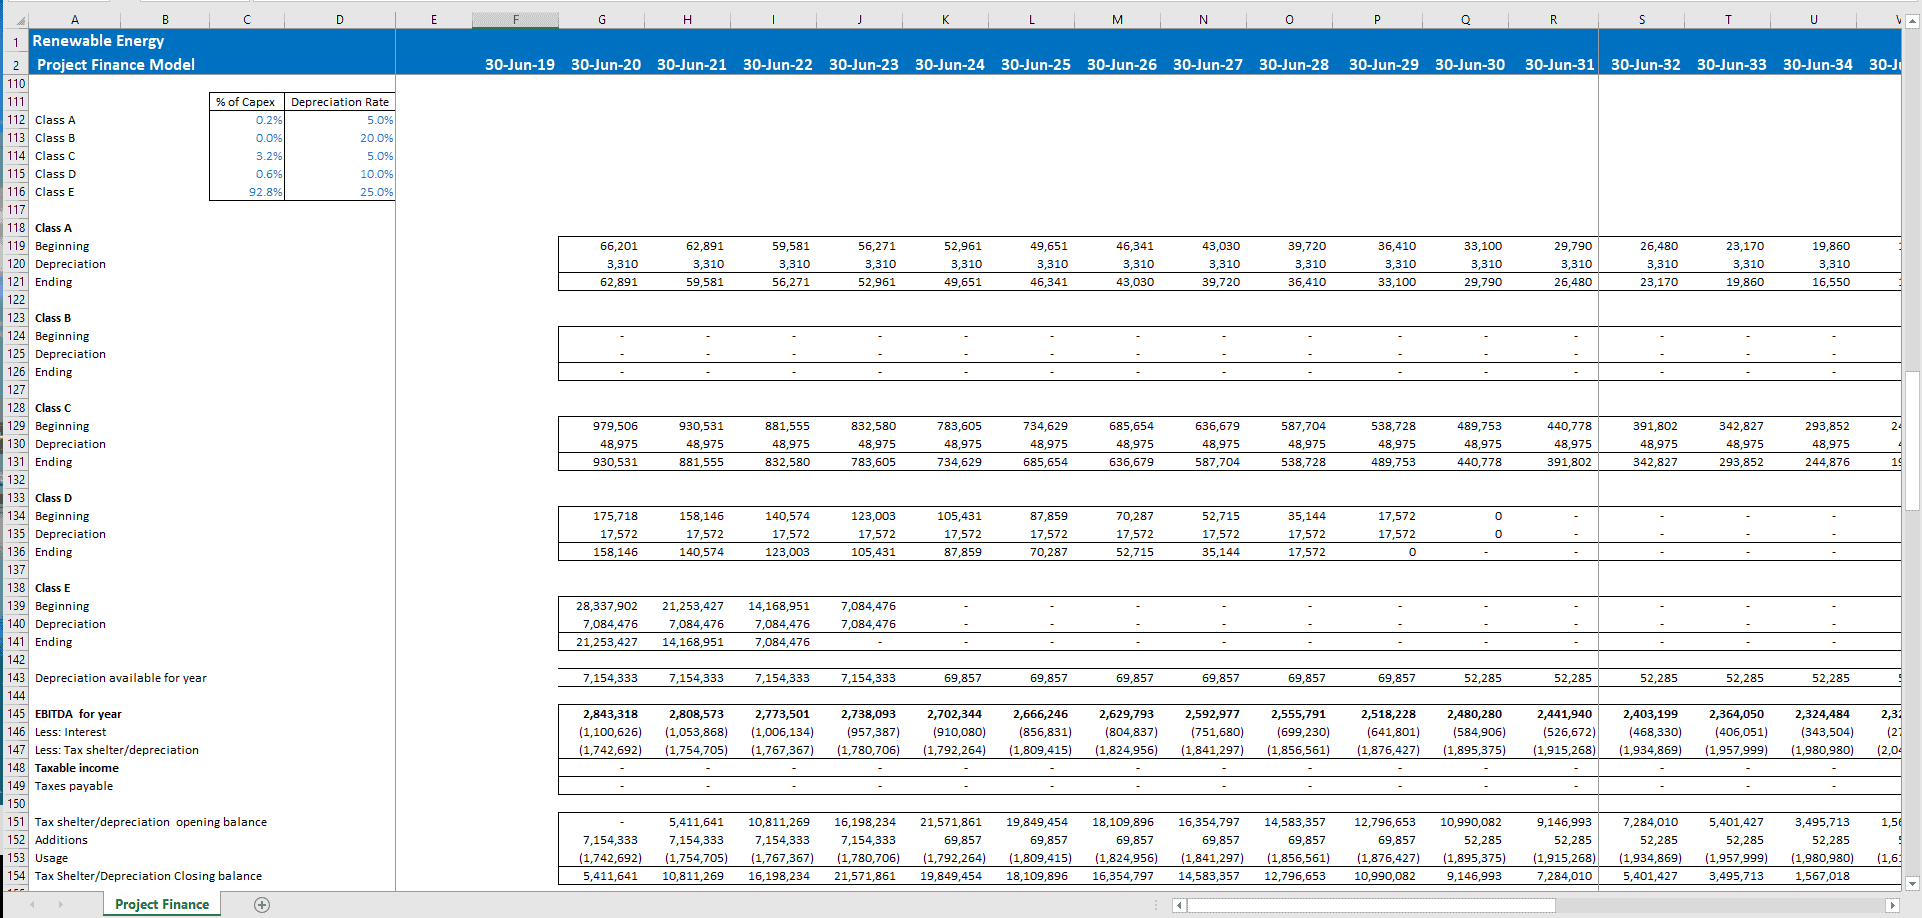
- Capex and Depreciation schedule
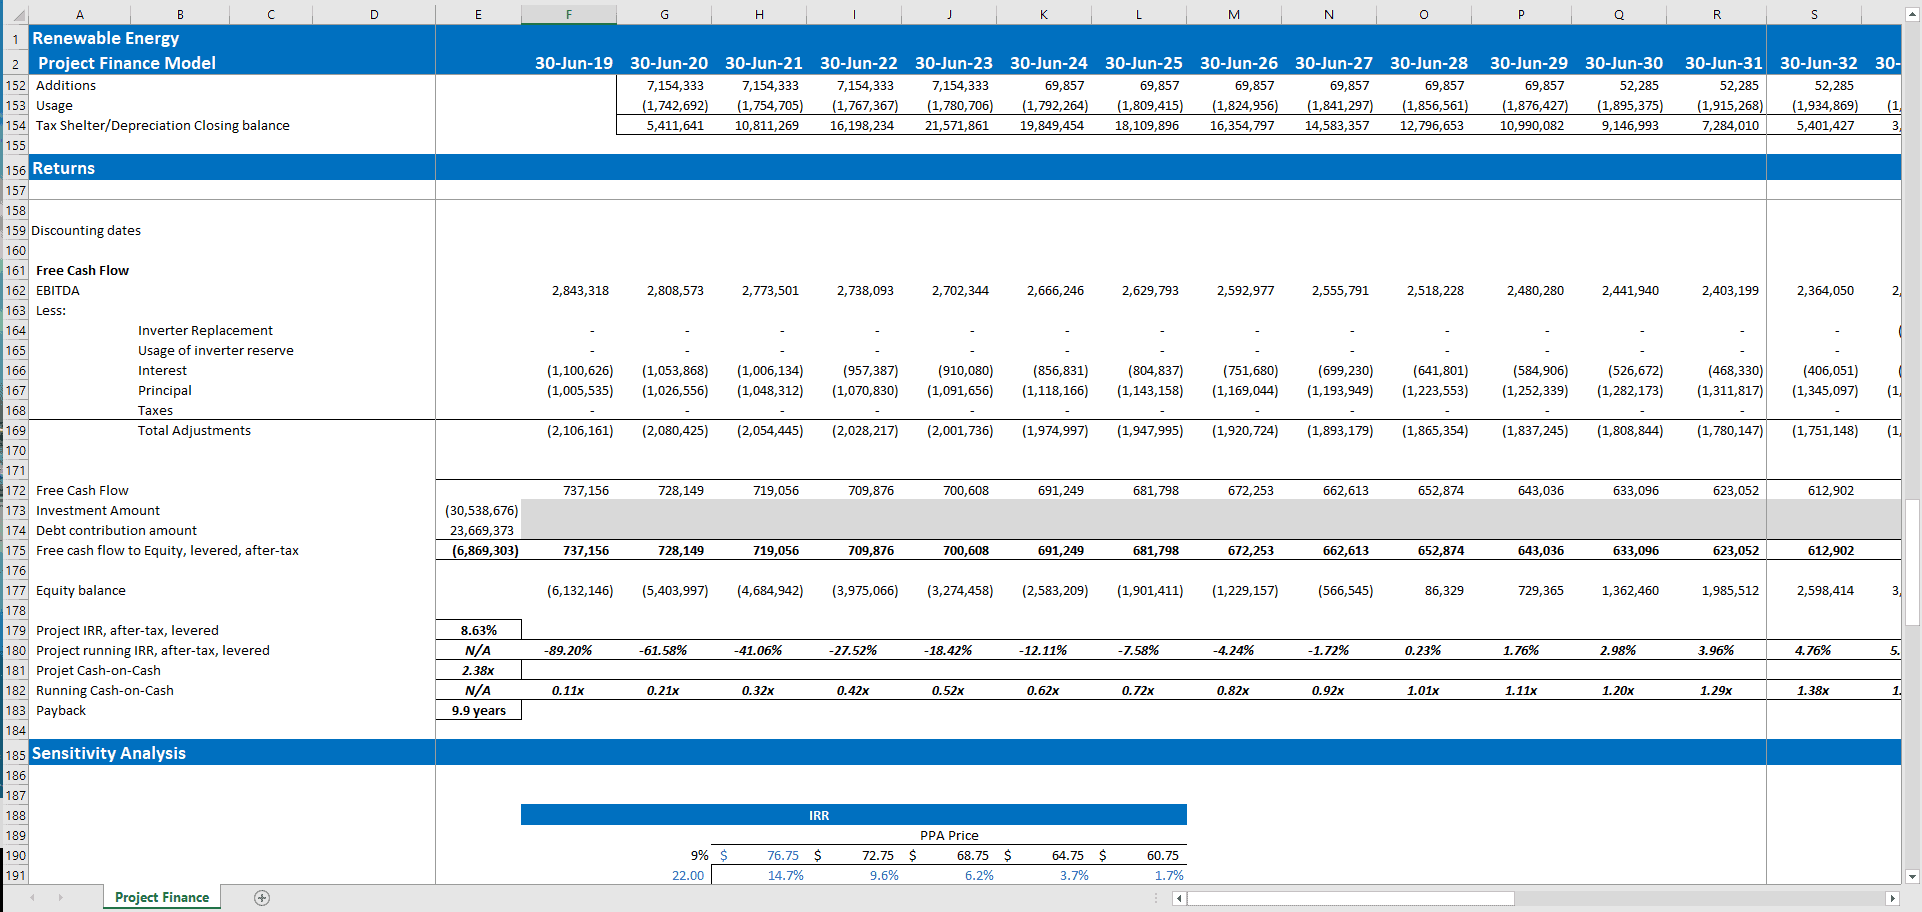
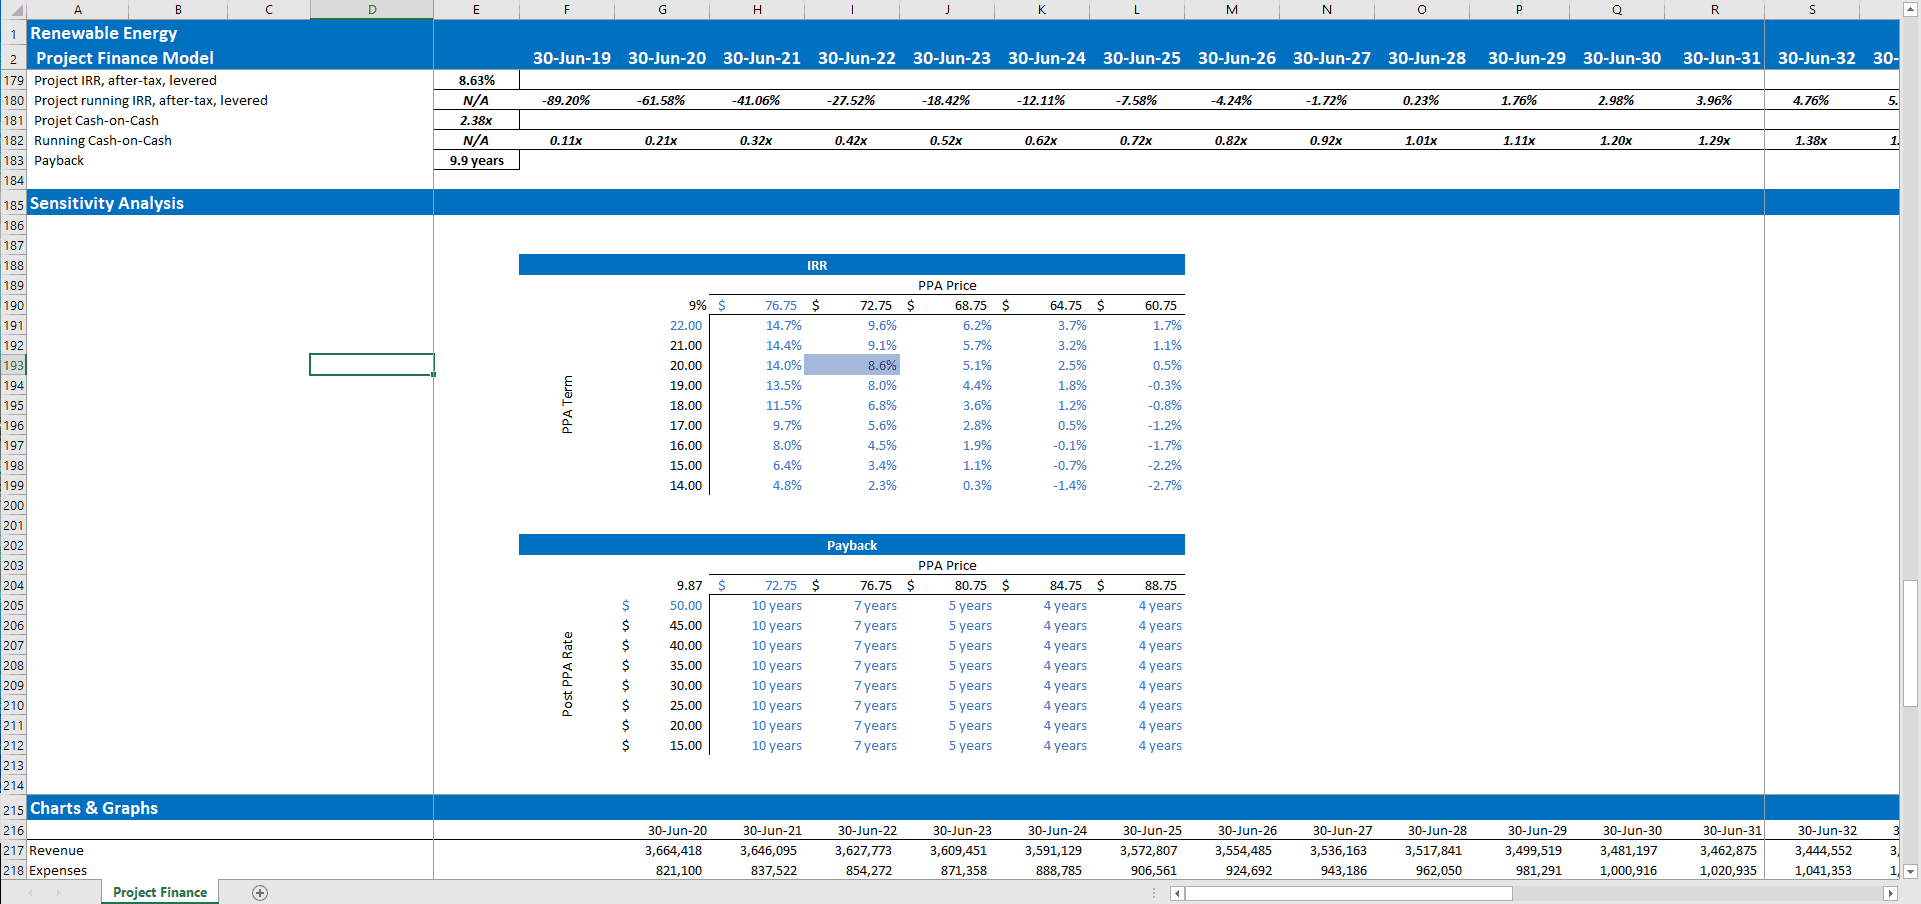
- Returns Section that calculates Free Cash Flow, IRR, Cash on Cash and Payback
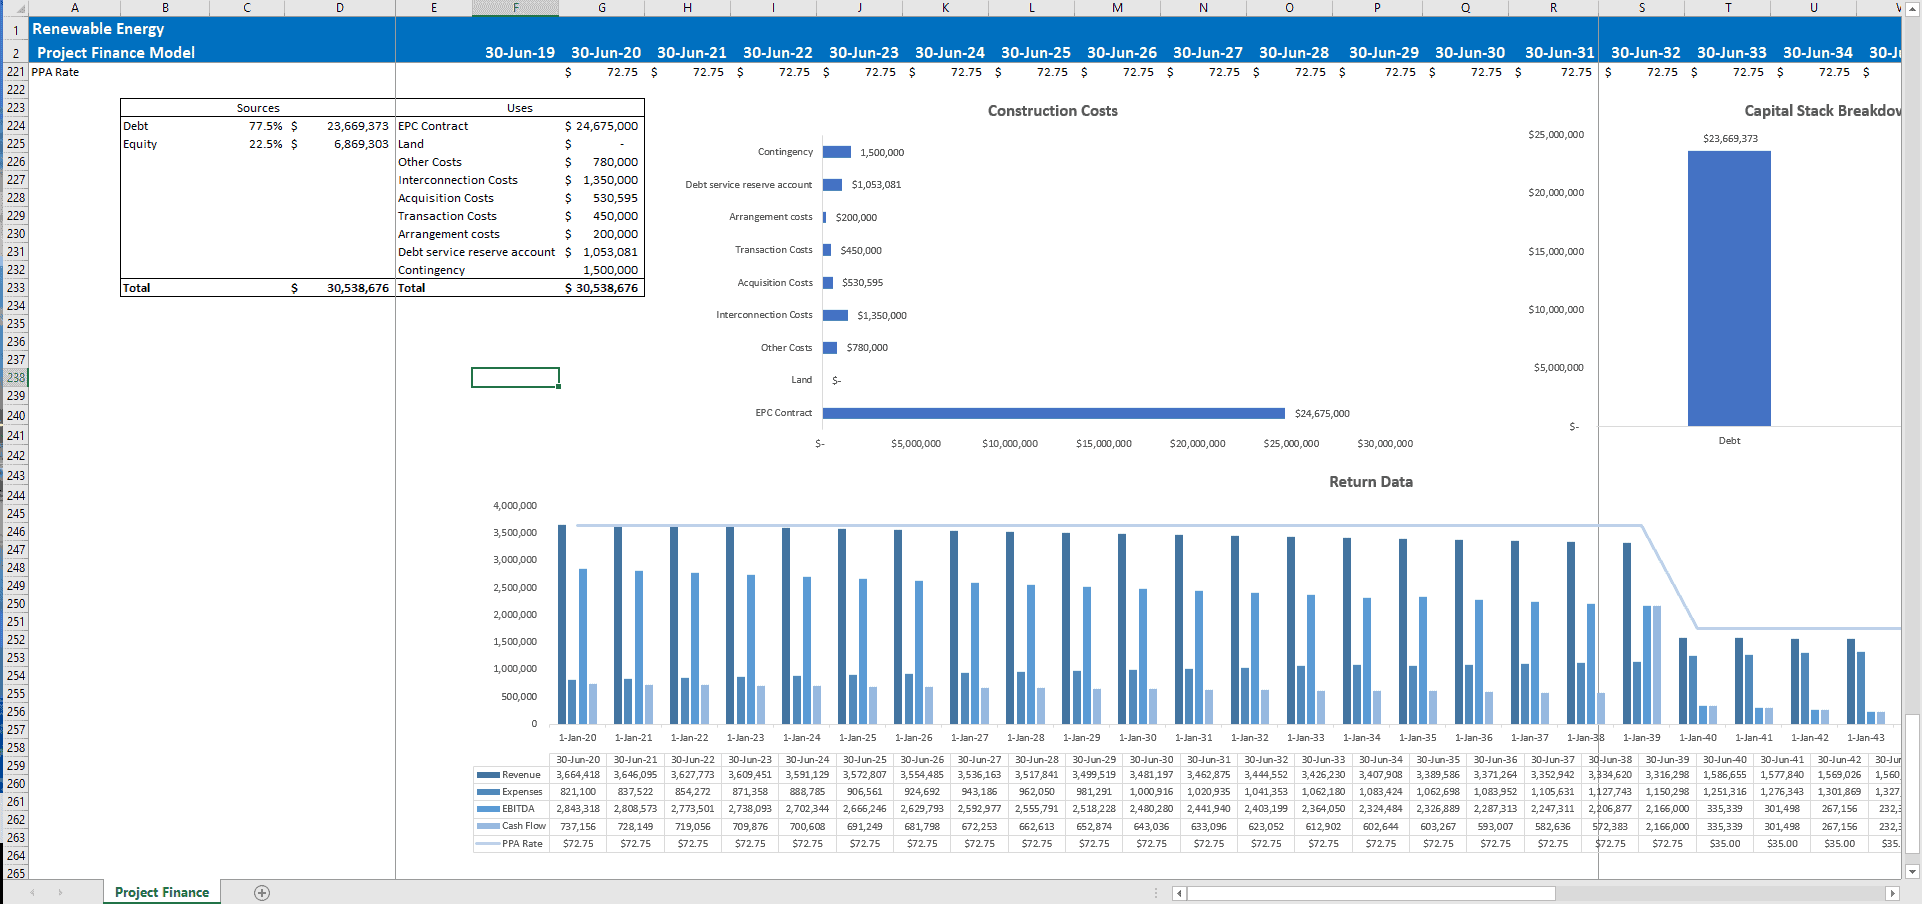
- Sensitivity Analysis of IRR and Payback, and Charts/Graphs for Construction Costs, Capital Stack and annual Returns data
The model starts with an Assumptions Section where you can enter information specific to the renewable energy project. The energy probability can be adjusted using the drop-down menu in cell G10. There are sections for general inputs, Capex, PPA terms, financing assumptions and associated costs for the project.
Below the assumptions, the Production and Financial Section breaks down the annual production and revenue forecasts for the project based on the assumptions above. The Debt Sizing Section covers the financing terms taken on with the project and the debt service coverage based on the annual profitability of the project. The Depreciation Section calculates the depreciation of the asset by class.
The Returns Section takes the financials from above to calculate the Free Cash Flow, Project level IRR and Cash on Cash along with the Payback on the operation. The model contains two Sensitivity Analysis tables for IRR and Payback. For visualization, there are graphs to display Construction Costs, Capital Stack and annual Returns data.
All cells in blue font are input cells where custom information can be entered. All cells in black font are formulas set to streamline the model. Sections are grouped to condense the model to view sections individually.
"Guiding businesses to achieve financial success through advanced tools and professional advising."
Business Address
5900 Balcones, Suite 4000
Austin, Texas 78731
Business Hours
Monday - Friday
8:00 AM - 5:00 PM


